Last updated: October 23, 2026
TL;DR Palantir for energy and utilities means using Foundry and AIP as a decision layer over grid, asset, weather, and customer data. PG&E used it for wildfire shutoff decisions, bp runs a digital twin on it, and CenterPoint chose it after Hurricane Beryl. It doesn’t replace SCADA, ADMS, or GIS. It connects them so planners and operators can act faster on outages, wildfire risk, and load growth. See our industries overview for other sectors.
Palantir for energy and utilities is Foundry and AIP used to join grid, asset, weather, and customer data into one model, so teams can make faster decisions on wildfire risk, outage restoration, asset replacement, and new load.
Utilities aren’t short on data. They’re short on time to use it.
The numbers explain why. The US Energy Information Administration reported that customers averaged about 11 hours of power interruptions in 2024, roughly double the prior decade’s average, and major events like hurricanes drove 80% of those hours. Meanwhile NERC’s latest long-term reliability assessment forecasts summer peak demand growing 224 GW over ten years. More storms. More load. Same grid, mostly.
Palantir has been selling into that pressure for five years now. This post sorts out what Palantir actually does in energy, which companies have publicly used it and for what, where Foundry fits next to the operational technology utilities already run, and when it’s the wrong call. We’re an independent Palantir consultancy, so we’ll be direct about both sides.
What Does Palantir Actually Do for Energy and Utility Companies?
It builds a shared model of the grid and the business. Foundry pulls data from GIS, SCADA historians, asset systems, work management, weather feeds, and customer systems into an Ontology of circuits, assets, crews, and customers, then runs decision apps on top.
That shared model is the whole point. A distribution planner, a wildfire risk analyst, and a storm restoration lead all look at the same circuit object, with the same asset health, the same vegetation data, and the same customer count behind it. Before that, they each had their own spreadsheet. Sometimes three.
Palantir’s own grid network modelling use case describes an unnamed European utility doing exactly this. It combined control system data with GIS into a grid digital twin, then built an app to help localize outages. Palantir notes the Ontology took about 12 months to build and is now a reusable library that can be deployed in weeks. That second half is the interesting part for anyone starting today.
What it isn’t. Foundry doesn’t operate breakers. Real-time grid control stays in SCADA and ADMS, where it belongs. Foundry sits a layer above, where planning, prioritization, and coordination decisions get made.
If you want the predictive maintenance basics for rotating equipment, our Palantir manufacturing guide covers them. This post sticks to grid and energy decisions.

Which Energy Companies Use Palantir, and for What?
Four public examples stand out. PG&E for wildfire and grid decisions since 2021, bp for an operations digital twin, The Nuclear Company for nuclear construction, and CenterPoint Energy as a founding partner of Palantir’s Chain Reaction initiative in late 2025.
| Company | What was announced | When | Notes |
|---|---|---|---|
| PG&E | Foundry for Public Safety Power Shutoff decisions, with plans to expand to asset risk and outage investigation | January 2021 | Palantir called it the first Foundry use in a major US utility’s operations |
| bp | 5-year strategic relationship adding AIP; Palantir in bp operations since 2014 | September 2024 | Digital twin fed by more than 2 million sensors |
| The Nuclear Company | A Nuclear Operating System built on Foundry for reactor construction | June 2025 | Part of Palantir’s Warp Speed program |
| CenterPoint Energy | Founding partner, with NVIDIA, of Chain Reaction for energy and AI infrastructure | December 2025 | Chose Palantir after Hurricane Beryl |
Sources, row by row. PG&E’s 2021 release, Offshore Technology on bp, World Nuclear News on The Nuclear Company, and InnovationMap’s CenterPoint coverage.
PG&E’s 2026 statement to Utility Dive describes Palantir tools organizing data for grid planning, operations, and wildfire risk mitigation. That same report says Southern California Edison also uses Foundry, though SCE didn’t comment.
One thing you won’t find. Published outcome numbers. None of these announcements include fewer ignitions, shorter outages, or dollars saved. That’s normal for utilities, which are cautious about public metrics. It also means you should ask any reference customer for the before-and-after directly.
How Do Utilities Use Foundry for Wildfire Risk and PSPS Decisions?
By putting weather forecasts, fuel and vegetation data, asset condition, and customer impact on the same circuit-level model. Teams can then decide which lines to de-energize, which customers to warn, and where to send inspection and vegetation crews first.
A Public Safety Power Shutoff decision is brutal. Shut off too little and a line could start a fire. Shut off too much and you cut power to medical baseline customers, water pumps, and hospitals during a heat wave. And the call usually gets made in hours, with forecasts changing.
What Foundry adds is speed and one version of the facts. Here’s the object chain we’d model for it.
- Weather forecast cells, from the utility’s meteorology team or a vendor, linked to the circuits they cover
- Circuit and segment objects, with conductor type, age, and recent inspection findings
- Vegetation and fuel data, often from LiDAR surveys and inspection programs
- Customers, especially medical baseline and critical facility accounts, linked to the circuits that serve them
- A PSPS event object that records every decision, who made it, and why
That last item matters later. After a shutoff, regulators ask why each circuit was or wasn’t de-energized. A logged decision on a shared model is a far better answer than a reconstructed email chain.
The same model drives the slower decisions too. Which circuits to underground first, where to spend vegetation budget, and which assets to inspect before fire season. One published case from a consulting firm describes a national gas and electric utility using Foundry geospatial risk mapping to prioritize undergrounding thousands of miles of line. The client is unnamed, so we’ll leave it at that.
How Does an Ontology Speed Up Outage Response and Storm Restoration?
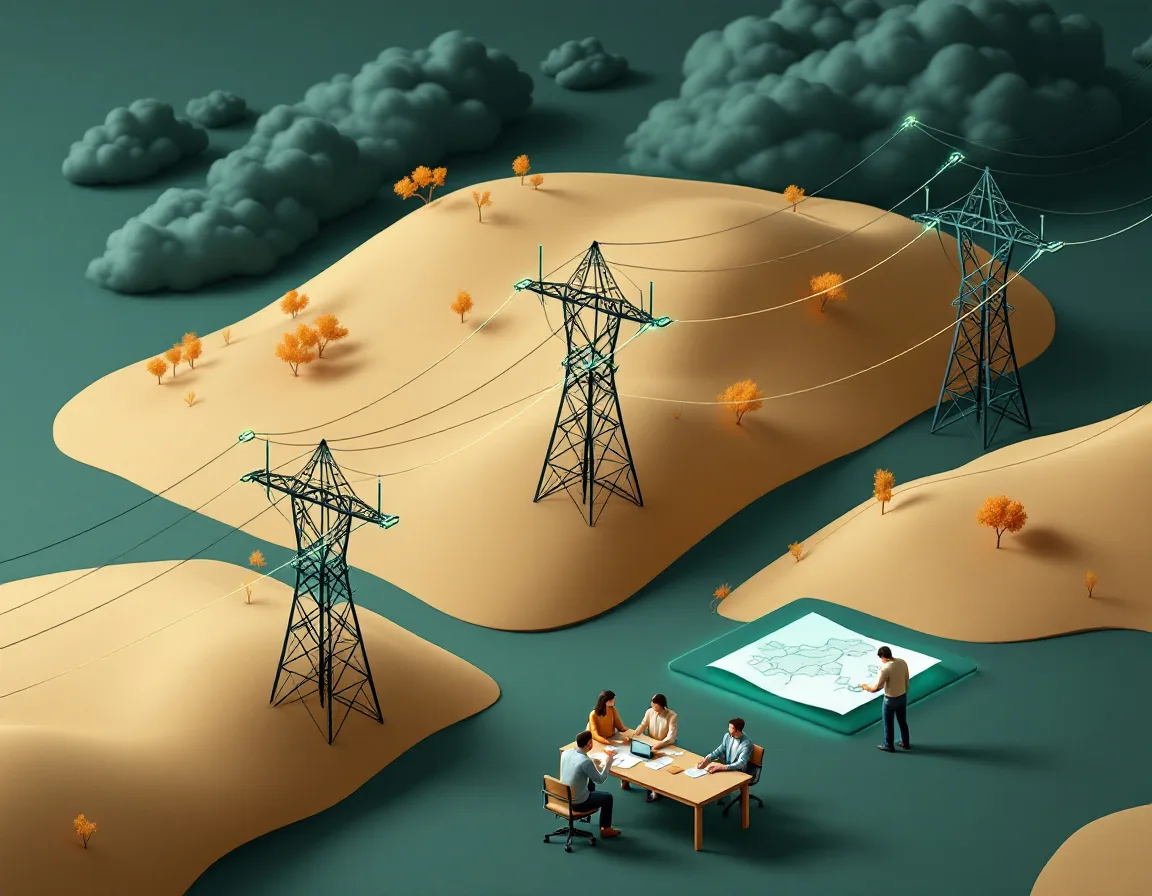
It gives every team the same live picture. Outage reports, crew locations, damaged assets, and critical customers sit in one model, so restoration leads can prioritize work, dispatch crews, and update customers without stitching systems together during the storm.
EIA’s numbers make the case for this better than we can. In 2024, Hurricane Beryl alone left 2.6 million Texas customers without power, Helene cut 5.9 million across ten states, and Milton cut 3.4 million in Florida. Major events averaged nearly nine hours of outage per customer that year, against about four hours a year over the previous decade.
Beryl is also where CenterPoint’s story starts. After restoration drew heavy criticism, the utility picked Palantir as what local coverage called its software backbone. That’s a familiar pattern. The big storm exposes how many systems a restoration lead has to check, and the post-storm review asks for something that joins them.
Storm restoration in a typical utility touches the outage management system, GIS, the work management system, crew and contractor rosters, mutual aid crews from other utilities, material inventory, and customer communications. Each one has its own view. During a storm, the coordination between them happens on calls and whiteboards.
A restoration app on an Ontology doesn’t replace the outage management system. It reads from it, joins crew and asset data, and lets a restoration lead see which critical customers are still out, which crews are closest, and which damaged assets need materials that aren’t in stock. Operator view? The winning feature is usually boring. A single list of critical facilities still out, sorted by restoration estimate, that everyone trusts.
Our Palantir Workshop guide covers how those operational apps are built.
Can Palantir Help With Interconnection Backlogs and Data Center Load Growth?
It can help organize the work, not shortcut the physics. Foundry can track interconnection requests, study status, network upgrades, and large load applications in one model, so planners see bottlenecks and dependencies across hundreds of projects instead of across spreadsheets.
The backlog is enormous. Lawrence Berkeley National Laboratory’s latest Queued Up data, summarized by the American Public Power Association, shows 2,061 GW seeking interconnection, down 10% from the prior year. Of the capacity that requested interconnection between 2000 and 2020, only 13% was operating by the end of 2025, and the median project took more than three years just to reach a signed agreement.
On the demand side, POWER Magazine’s coverage of NERC’s 2025 Long-Term Reliability Assessment reports a 10-year summer peak growth forecast of 224 GW, up 69% from the prior forecast, with 13 of 23 assessment areas at elevated or high risk. Not everyone agrees. Grid Strategies argues NERC overstates the risk, partly by overestimating data center load. Either way, planners are buried in requests.
That’s the context for Palantir’s Chain Reaction, launched in December 2025 with CenterPoint and NVIDIA to coordinate generation, transmission, and data center buildout on AIP and the Ontology.
Where Foundry genuinely helps here is dull and valuable. Tracking every large load request, its study stage, its dependencies on substation upgrades, and its equipment lead times in one place. Transformers alone can take years to arrive. A model that links each request to the long-lead equipment it needs makes the real critical path visible.
Where it doesn’t help? Power flow studies. Those run in specialist engineering tools, and they should.

How Does Palantir Compare to C3 AI, GE Vernova GridOS, and ADMS Vendors?
Different layers. ADMS and GridOS-style grid software run and orchestrate the network itself. C3 AI sells prebuilt AI applications, including for utilities. Palantir is a general data and decision platform that utilities model their own way.
| Option | Center of gravity | Usually a fit when | Watch out for |
|---|---|---|---|
| Palantir Foundry and AIP | Ontology-based decision platform across grid, assets, and operations | Many systems, many teams, decisions that cross them | Needs build effort and a data owner who stays |
| C3 AI | Prebuilt enterprise AI applications, including asset and reliability apps | You want a packaged app for one problem | Less flexible outside the packaged scope |
| GE Vernova GridOS and similar grid orchestration | Grid software for planning and operating the network | Real-time network management and DER orchestration | Not built as a cross-business decision layer |
| ADMS, OMS, and GIS vendors | Core operational technology systems | Running the grid and managing outages | Each sees its own slice of the picture |
LNS Research’s 2026 analysis of why Palantir pulled ahead of C3 in industrial AI points to the same thing we see. Palantir wraps existing systems rather than asking you to replace them, and puts engineers on site to build with the customer.
So the real comparison isn’t Palantir versus your ADMS. Most utilities that use Foundry keep every one of those systems. The question is whether you need a layer that joins them for decisions no single system owns. If you only have one decision to support, a packaged app may be cheaper. Our Foundry vs Databricks vs Snowflake comparison covers the data platform side of that choice.
How Long Does a Utility Foundry Deployment Take?
Months for a first decision app, a year or more for an enterprise grid model. Palantir’s own European utility example took about 12 months to build its grid Ontology. Utilities starting now can often reuse patterns and move faster on a narrow first use case.
The sequence we’d use for a utility.
- Pick one decision with a clock on it, like wildfire season inspection priority or storm restoration
- Connect GIS and the asset register first, because almost everything joins to them
- Add the operational feeds that decision needs, such as weather, outage events, or inspection findings
- Model circuits, assets, crews, and customers as Ontology objects with clear owners
- Build one Workshop app for the people who make that decision, and test it in a real event or drill
- Write down the decisions it logged and review them with the team after the event
- Expand to the next decision using the same objects
What slows utilities down usually isn’t the platform. It’s GIS data quality, security reviews for operational technology data, and NERC CIP questions about what can leave the control network. Start those conversations in week one. Our Foundry implementation guide covers the general phases.
When Is Palantir the Wrong Choice for a Utility?
When the problem is real-time control, when one packaged app would do, or when nobody will own the model. Foundry earns its cost on cross-system decisions. It’s expensive overkill for a single dashboard.
A few honest cases.
- You need grid control or DER dispatch in real time. That’s ADMS and grid orchestration territory
- Your problem is one report from one system. A BI tool is cheaper
- No team will own the Ontology after go-live. Models rot quickly without an owner
- Your board or regulator has concerns about Palantir as a vendor. That debate is public, and protesters targeted PG&E and SCE at DistribuTECH 2026 over their use of Foundry. Plan for the conversation instead of hoping it won’t happen
We’ll admit the bias. We build on Palantir and we’d like more utilities to use it. But we’ve seen the two-year grid model that nobody uses because it started with data instead of a decision. Start with the decision.
Start With One Decision That Has a Deadline
Three takeaways. Palantir in energy is a decision layer over the systems utilities already run, not a replacement for SCADA, ADMS, or GIS. The public examples, PG&E, bp, The Nuclear Company, and CenterPoint, cluster around wildfire, operations twins, construction, and grid buildout. And the projects that work start with one time-bound decision, like fire season or storm restoration, then grow.
PAL4C Labs is an independent, Palantir-exclusive consultancy that builds Foundry Ontologies, pipelines, and AIP workflows for asset-heavy operators. We’re not affiliated with Palantir and haven’t worked on the deployments named above.
Planning for next fire season or storm season? Send us your current systems and the one decision that keeps your operations leads up at night. We’ll scope a first decision app with you, including the data it needs and what it would take to have it ready before the season starts.
Questions Utility Teams Ask About Palantir
Does PG&E Use Palantir?
It does. PG&E announced Foundry in January 2021 for Public Safety Power Shutoff decisions, with plans to expand into asset risk and outage investigation. In 2026 it described Palantir tools as organizing data for grid planning, operations, and wildfire risk mitigation.
What Is Palantir Chain Reaction?
An initiative Palantir launched in December 2025 to coordinate energy and AI infrastructure buildout, from generation to transmission to data centers, using AIP and the Ontology. CenterPoint Energy and NVIDIA were the founding partners.
Can Foundry Replace Our ADMS or Outage Management System?
No, and it isn’t designed to. Those systems run the grid and manage outages in real time. Foundry reads from them and joins their data with assets, crews, weather, and customers for planning and coordination decisions.
Is Palantir Used in Oil and Gas?
bp is the best-known case. Palantir has worked in bp’s operations since 2014, including a digital twin fed by more than 2 million sensors, and the two signed a 5-year deal in 2024 that added AIP.
How Is Palantir Different From C3 AI for Utilities?
Mostly in approach. C3 AI leans on prebuilt applications for specific problems. Palantir gives you a platform to model your own grid and business, then build apps on it, which is more flexible but needs more build effort.
Can Palantir Help With Data Center Load Requests?
It can organize them. A Foundry model can track each large load request, its study stage, the substation upgrades it depends on, and long-lead equipment, so planners see the real critical path. The engineering studies themselves still run in specialist tools.
How Long Before a Utility Sees Value From Foundry?
A few months for a first decision app on a narrow problem, if GIS and asset data are reachable. An enterprise grid model takes longer. Palantir’s own European utility example took about a year to build its Ontology, though the result is now reusable.